

Welcome to our new blog series, where we delve into the world of Advanced Candlestick Patterns!
If you’re a trader looking to gain an edge in the markets, understanding these patterns is crucial. But what sets our series apart? We’re here to explore lesser-known, yet highly effective candlestick patterns that can elevate your trading game.
In this blog series, we’ll skip the basics and dive straight into the advanced territory. We’ll uncover patterns like Bullish and Bearish Counter-Attack Candlestick Patterns, shedding light on their significance and how they can be applied in real trading scenarios.
But before we get into the specifics, remember that candlestick patterns work best on higher time frames. So, grab your daily, weekly, and monthly charts, and let’s embark on this enlightening journey together!
Bullish and Bearish Counter-Attack Candlestick Patterns:
The Bullish and Bearish Counter-Attack Patterns, characterized by two candlesticks moving in opposite directions, signal potential trend reversals. Whether it’s the bullish variant appearing after a downtrend or the bearish variant following an uptrend, these patterns offer valuable insights for traders.
Pattern Identification:
- Bullish Counter-Attack: Forms at the bottom, with the first candle red and the second green. The second candle opens lower but closes at the first candle’s closing price.
- Bearish Counter-Attack: Occurs at the top, with the first candle green and the second red. Similar to the bullish variant, the second candle opens higher but closes at the first candle’s closing price.
Trading Strategies:
- Identify Trends: Ensure a clear uptrend for bearish signals and a clear downtrend for bullish signals.
- Confirm with Tools: Use other technical indicators to validate counter-attack signals.
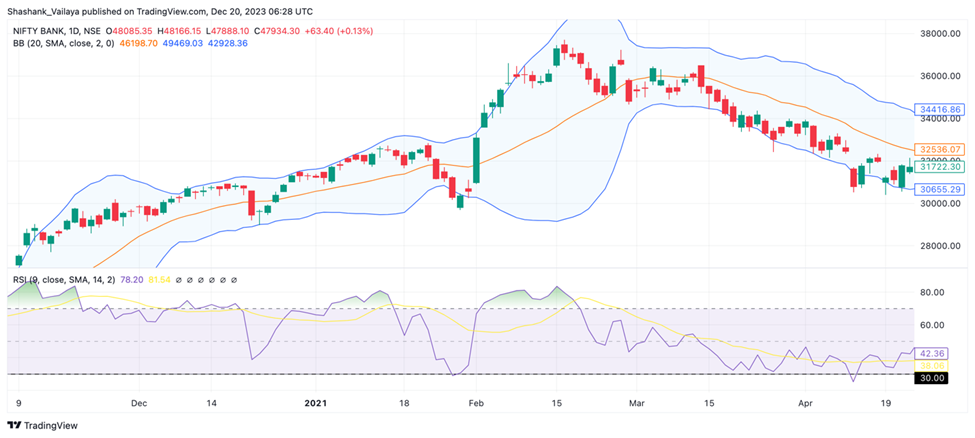
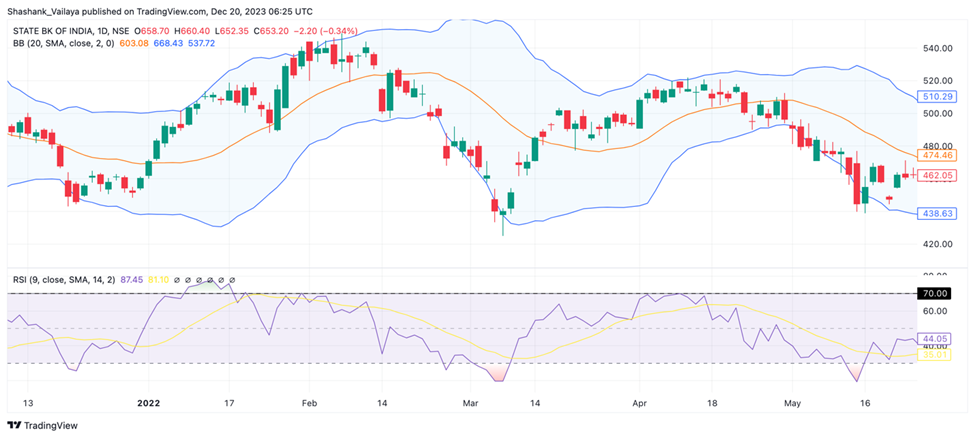
- Look for Confirmations: Combine signals with Bollinger Bands and RSI for stronger reversal indications.
- Set Entry and Exit Points: Trigger entry upon pattern recognition, set stop-loss below the pattern’s low, and aim for a reward-risk ratio of at least 3:1.
Practical Examples:
Let’s analyze Bullish and Bearish Counter-Attack signals on actual price charts:
Bullish Signal: Bank Nifty on January 28, 2021, indicated a strong reversal from support levels.
Bearish Signal: SBI on February 21, demonstrated a powerful reversal from overbought conditions.
With these insights, you’re now equipped to identify and trade Counter-Attack signals effectively!
Stay tuned for more advanced candlestick signals in our upcoming blogs. And remember, if you want to explore further, visit www.hedged.in today!
Happy Trading!