
Why Many Investors Mistake Trading Volume for Safety
Many retail investors say things like, “This stock has 50 crore shares traded today! It must be easy to buy and sell.” This sounds sensible. After all, if many shares are being traded, it should be simple to enter or exit a stock.
But this idea is not correct. It gives a false sense of safety. In fact, this misunderstanding causes many Indian investors to lose a lot of money every year.
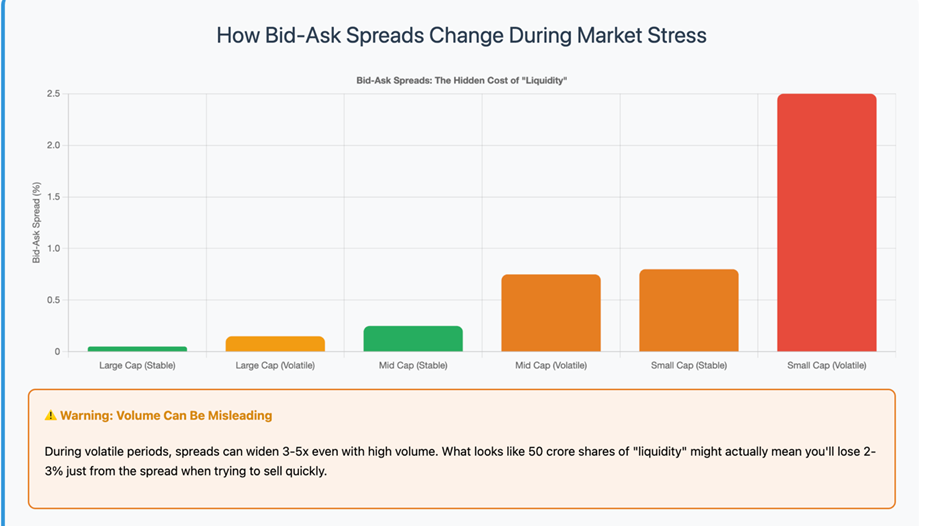
The real situation is that even on days with very high trading volume, it can be hard to buy or sell shares quickly at a fair price. For example, data from the NSE shows that on unstable days, the difference between the prices to buy and sell (called the bid-ask spread) can become 3 to 5 times wider than normal in mid-sized stocks. So although many shares are traded, investors may not be able to sell quickly without losing money.
This issue is not just about numbers. It affects how millions of investors make decisions in India.
Why High Volume Feels Safe But Is Not
People naturally feel safer when they see many others doing the same thing. When investors see a lot of shares changing hands, their mind tells them, “Many people are buying and selling, so this must be a good and stable stock.”
But there are two wrong ideas in this thinking:
Feeling Safe in Numbers: We believe that if many people trade, the decision to buy or sell must be right. But most of the volume comes from computers running trading programs, very short-term traders, or big investors moving large portfolios, not many steady buyers and sellers.
Thinking You Can Always Sell: If 5 crore shares were traded, people assume they can sell their small number of shares whenever they want. But this is like driving in heavy traffic and thinking you can change lanes easily, lots of cars do not mean easy movement.
Understanding Different Types of Volume
There are three types of trading volume that create different risks for investors:
Panic Volume occurs when bad news spreads and many people want to sell at the same time. Volume becomes very high, but prices can fall fast. It becomes hard to sell without losing money even with large volume. During these times, algorithmic traders often step back, making the situation worse.
Algorithmic Volume comes from computers trading very fast and in small amounts. High-frequency trading firms can account for 40-60% of daily volume in major stocks, but they provide liquidity only when markets are calm. When volatility spikes, these programs often shut down automatically, leaving retail investors without the liquidity they expected.
Speculative Volume happens in small stocks or options where traders seek quick profits. Prices may jump up and down a lot, creating artificial volume spikes. This type of volume often disappears suddenly when sentiment changes, trapping investors who thought the high activity meant safety.
The Danger With Small Stocks and Market Manipulation
Small stocks often create the most problems for investors. Sometimes a few traders create fake activity through “circular trading”—buying and selling shares between themselves to make the volume and price appear to be growing. This practice, while illegal, still occurs and draws in other investors who think the stock is becoming popular.
These manipulators use multiple accounts and coordinate their trades to create the illusion of genuine interest. They might trade the same 1 lakh shares back and forth 50 times, creating 50 lakh shares of artificial volume. When these traders exit and leave, volume drops suddenly, and prices fall fast. Many investors find it hard to sell, losing money because the “liquidity” they thought was real was manufactured.
What Real Liquidity Looks Like
Smart investors look beyond volume and examine market depth—how many buy and sell orders are placed at different price levels near the current market price.
For example, a stock priced ₹100 with high volume is not actually liquid if the order book looks like this:
| Price | Buy Orders | Sell Orders |
| ₹102 | 0 | 50 |
| ₹101 | 0 | 150 |
| ₹100.5 | 0 | 300 |
| ₹100 | 0 | 0 |
| ₹99.5 | 500 | 0 |
| ₹99 | 200 | 0 |
| ₹98 | 100 | 0 |
This order book shows very few buy and sell orders near the current price of ₹100. If one big seller places an order, the price can drop to ₹99.5 or lower because there are not enough buy orders nearby to absorb the selling pressure.
Real liquidity looks different, it has many buy and sell orders clustered around the current price, creating a cushion that prevents large price swings from single trades.
The Options Market: A Liquidity Mirage
Options may appear very liquid because many contracts trade daily, especially for major indices like Nifty. Bank Nifty options can show 50+ lakh contracts traded, making them seem highly liquid. But this volume comes mainly from market makers and institutions hedging their portfolios, not from diverse retail participation.
When markets become volatile, market makers, who provide most of the liquidity, often widen their bid-ask spreads dramatically or temporarily stop quoting prices. During the March 2020 crash, some Nifty option spreads that were normally ₹0.05 wide suddenly became ₹5-10 wide. Retail traders found they could only sell their options at prices far below fair value, despite the seemingly high trading volumes.
Circuit Breakers and Trading Halts: When Liquidity Disappears Completely
Even high-volume stocks face situations where trading stops entirely. When a stock hits its upper or lower circuit limit (usually 5%, 10%, or 20% depending on the stock), all trading halts until the next day or until the circuit is relaxed.
During these halts, all the volume in the world cannot help you exit your position. Stocks often gap up or down significantly when trading resumes, meaning investors cannot sell at the circuit price they expected. This is another way that volume fails to guarantee liquidity when you need it most.
Similarly, if exchanges detect unusual trading patterns or receive material information, they can halt trading entirely. Your ability to trade becomes zero regardless of previous volume levels.
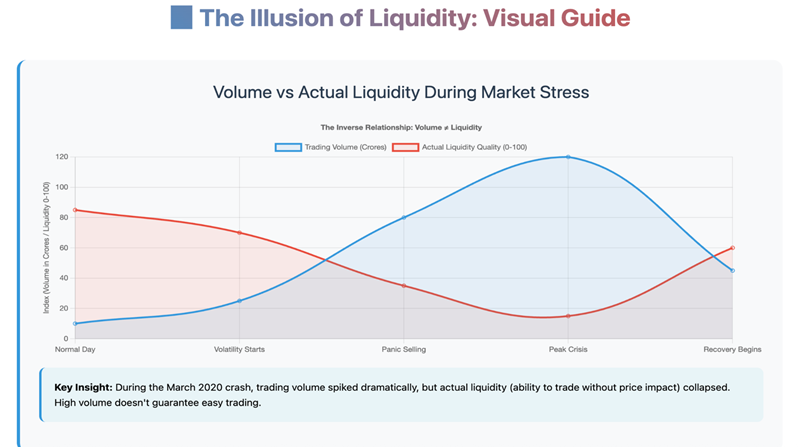
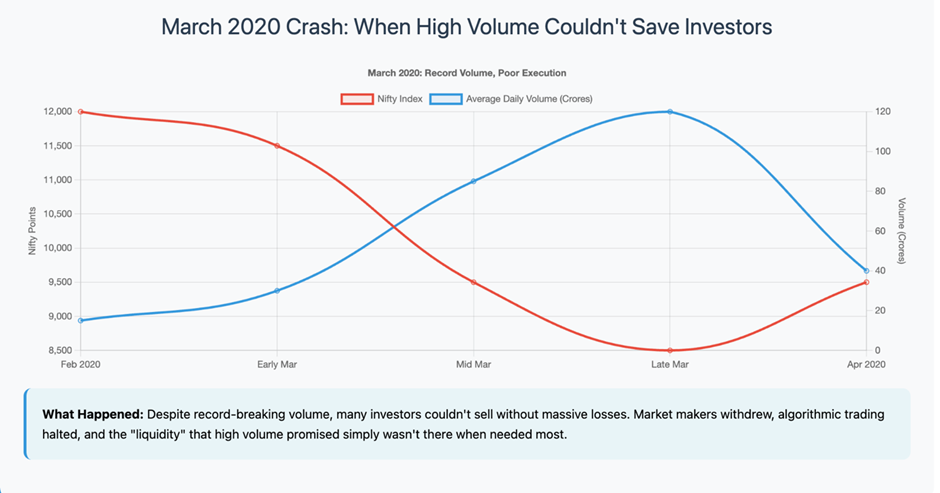
Lessons From the 2020 Market Crash: Volume Without Liquidity
During March 2020, many stocks that usually traded 5-10 crore shares daily suddenly saw 50-100 crore shares change hands. Despite this massive volume increase, the quality of liquidity deteriorated severely.
What happened: Market makers and algorithmic traders, who normally provide tight spreads, withdrew from the market. The high volume came mostly from panicked selling and opportunistic buying at much lower prices.
The result: Many investors found they could only sell at prices 3-5% below the previous day’s closing price, despite the appearance of massive liquidity. Some discovered that their “market” sell orders were filled at prices far below what they expected because there were gaps in the order book.
This period demonstrated that volume alone means nothing if the orders are not well-distributed around the current price.
Why Institutions Have Better Liquidity Access
Large investors don’t rely on the same liquidity that retail investors see. They have several advantages:
Dark Pools: Institutions can trade large blocks in private exchanges without showing their orders to the market. This prevents their trades from moving prices and provides genuine liquidity away from public markets.
Prime Brokerage Relationships: Big investors have direct relationships with market makers who commit to providing liquidity even during stressed conditions, usually for a premium.
Algorithmic Execution: Institutions use sophisticated software that breaks large orders into smaller pieces, timing their execution to minimize market impact. They can also access multiple exchanges simultaneously to find the best liquidity.
Block Trading Networks: Large investors can find other institutions willing to trade large blocks directly, bypassing public markets entirely.
Retail investors typically see only the top 5-10 price levels on their trading apps and compete for the same limited liquidity during volatile periods.
Practical Tools and Resources for Assessing Real Liquidity
Here are specific tools and techniques investors can use to evaluate true liquidity:
Market Depth Analysis:
- Use advanced trading platforms like XTS, Greek soft, Nest Trader, ODIN Diet, or TradingView that show Level 2 data
- Look for at least 10-15 price levels on both buy and sell sides
- Check that order sizes are meaningful (not just 1-2 shares per level)
Liquidity Metrics to Track:
- Average bid-ask spread: Should be less than 0.1% for large-cap stocks, under 0.3% for mid-caps
- Impact cost: NSE publishes this—measures how much prices move for a ₹50 lakh trade
- Volume-weighted average price (VWAP) deviation: Good liquidity keeps stock prices close to VWAP throughout the day
Red Flags to Avoid:
- Sudden volume spikes without news (may indicate manipulation)
- Wide bid-ask spreads that persist throughout the day
- Frequent gaps between price levels in the order book
- Volume concentrated in specific hours rather than spread throughout trading
Reliable Liquidity Indicators:
- Consistent daily volumes over 3-6 months (not just recent spikes)
- Presence of institutional investors (check shareholding patterns)
- Multiple market makers active in the stock
- Tight spreads maintained even during market stress
How to Protect Yourself: A Practical Framework
Before Investing:
- Check 6-month average daily volume, not just recent peaks
- Verify that bid-ask spreads remain reasonable throughout different market conditions
- Ensure the stock trades actively across multiple exchanges, not just NSE
- Look for institutional ownership as a sign of genuine long-term interest
While Trading:
- Use limit orders instead of market orders, especially in volatile conditions
- Break large trades into smaller sizes spread over time
- Avoid trading during the first and last 30 minutes when spreads are typically wider
- Monitor the order book depth, not just volume numbers
Risk Management:
- Never invest more than 5-10% of your portfolio in any single mid or small-cap stock
- Keep cash reserves to avoid forced selling during liquidity crunches
- Set stop-losses based on time and market conditions, not just price levels
- Have exit strategies planned before entering positions
When High Volume Actually Indicates Problems
Sometimes high volume is a warning signal rather than a comfort:
Earnings Disappointments: When companies report poor results, volume spikes often indicate selling pressure rather than healthy trading interest.
Regulatory Actions: High volume following SEBI notices or legal issues usually signals institutional exit rather than opportunity.
Promoter Sales: When promoters sell stakes, the high volume often represents supply overhang that can pressure prices for months.
Sector Rotation: During sector selloffs, high volume in affected stocks usually indicates funds moving money elsewhere, creating temporary liquidity that disappears quickly.
Final Thoughts: Activity Isn’t the Same as Safety
The biggest mistake is thinking a busy market is a safe market. High volume means many trades happened, but it does not guarantee you can buy or sell easily without losses when you need to.
True liquidity is quiet and steady. It doesn’t create flashy volume numbers or dramatic price movements, but it allows smooth trading when needed. It’s like having multiple lanes of slow, steady traffic rather than a single lane of speeding cars.
Fake liquidity creates excitement and big numbers but disappears precisely when you need it most, during market stress, company-specific problems, or when you need to exit quickly.
The most successful retail investors focus on stocks with genuine, sustainable liquidity and avoid being seduced by volume spikes that often signal problems rather than opportunities.
Remember: All investing carries risk, and past trading patterns do not guarantee future liquidity. Always research thoroughly and never invest more than you can afford to lose. When in doubt, stick to large-cap stocks with consistent institutional interest—they may be less exciting, but they provide the real liquidity that protects your capital when markets turn difficult.