

You Sold in October. Then Watched Your Stock Rise Every Week After
October 2024. Your phone lit up with headlines. “FIIs pull ₹1 lakh crore from Indian markets.” Your broker’s app showed the chart in blood red. Foreign investors were leaving. That meant danger. You looked at your portfolio. You were nervous. You’d heard FIIs determine market direction. If they’re selling, shouldn’t you?
You sold at ₹2,400. Two weeks later, the stock was at ₹2,600. By December, ₹2,800. You watched it climb every single week despite the FPI selling that had terrified you into exiting.
That’s when you realized: you were reading the right numbers. You were just reading the wrong meaning.
The thing that shocked you when you dug deeper. While FIIs were pulling out ₹1.4 lakh crore that year, domestic investors were putting in ₹4,37,702 crore. That’s 3 times more money. But you never heard about it. No headlines. No apps sending you alerts.
FPI flows made noise. Domestic flows made returns.
You’re not alone. Most retail investors check FII flows every morning. Look at OI buildup at strike prices. Celebrate market cap milestones. They think these numbers tell the story of the market. These numbers tell a story. Just not the story that predicts your returns.
The real situation is that the three numbers you’re obsessing over caused you to sell early. Meanwhile, the three numbers you’re ignoring would have told you to hold.
Why you check the wrong numbers (and why it makes sense)
Your brain naturally looks for visible signals. When something is published daily by the exchange, it feels important. When thousands of other investors are talking about FII flows or OI levels, your mind thinks: “This must matter. Everyone’s discussing it.”
But there are two wrong ideas in this thinking.
First: Just because a number is visible doesn’t make it predictive. Volume traded at NSE is visible and constantly updating. That doesn’t mean it predicts where the stock goes next month. FII flows are visible and published every day. That doesn’t mean they determine market direction.
Second: You’re tracking what OTHER people are doing instead of what the BUSINESS is doing. FII flows tell you what foreign investors decided today. OI levels tell you where options traders have positioned. Market cap tells you what the aggregate price became. None of this tells you if the business itself is actually generating value.
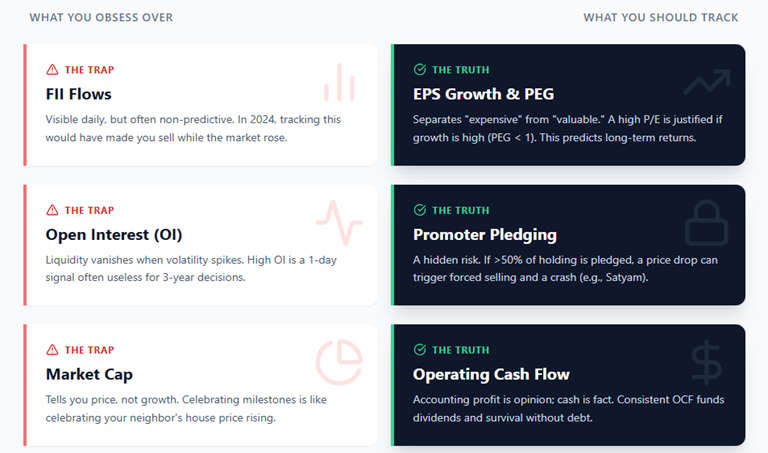
The Three Numbers You’re Obsessing Over
Number 1: FII Flows
You probably think this way: “FIIs know the markets. When they’re buying, I should buy. When they’re selling, I should worry.” Here’s what actually happened in 2024. From January to November, FIIs pulled out ₹1.4 lakh crore. October alone saw ₹1 lakh crore in outflows. This was the worst year on record for FPI selling. By June 2024, FII holdings had fallen to a 12-year low of 17.38% of the market. During this entire period, the Nifty was up 9.24%.
How?
Because domestic investors were buying. DIIs (mutual funds, banks, insurers) invested ₹4,37,702 crore. Retail investors opened 300,000+ demat accounts every month and contributed through SIPs worth ₹2.42 lakh crore. This nearly tripled the impact of FPI selling.
By the end of 2024, DIIs held 16.90% of the market. Nearly equal to FIIs. For the first time in a decade, domestic investors mattered more than foreign ones. What determines market direction now? Not FPI flows. Domestic flows.
But FPI flows are what you track every morning. Why? Because they’re visible. Easy to interpret. Create a sense of urgency. “FIIs are selling today” feels actionable. “DIIs are buying steadily” feels boring.
Number 2: Open Interest (OI) Data
You probably think this way: “High OI at the 19,500 strike means there’s resistance there. Rising OI with price going up means the move is strong.”
Here is the mechanism you are missing. When you see Nifty 50 options trading tens of lakh contracts daily, you assume there is deep liquidity. That assumption holds but that liquidity often flows from three groups: market-makers quoting prices, institutions hedging portfolios, and algorithmic traders running strategies. These players provide liquidity when markets are calm. Once volatility spikes, they retreat.
In March 2020 the crash triggered by pandemic fear devastated the markets: Nifty 50 dropped nearly 23% in that month. What looked like high open interest and heavy volume failed to translate into tradable liquidity, bid-ask spreads blew up as the calm liquidity providers vanished. High OI meant almost nothing.
Number 3: Market Cap Milestones
You probably think this way: “India’s market cap hit $5 trillion! We’re doing great. This company’s market cap crossed ₹1 lakh crore, so it must be good.” Here’s what market cap actually tells you. Nothing about growth. Everything about price.
Market cap = Share Price × Shares Outstanding.
In 2024, India’s market cap grew 18.4%, reaching $5.18 trillion. During the same period, company earnings grew 7-8%. The difference? P/E expansion. Investors paid more for each rupee earned. This is fine for one quarter. Dangerous if it continues. Because when sentiment shifts, valuations compress faster than earnings fall.
Many mid and small-cap stocks were up 30-50% in 2024. EPS growth? 10-15%. This gap exists for one reason. Speculation. Not business improvement. When the market corrects, these stocks fall 30-40% despite similar EPS. The gap closed, not because business got worse, but because valuations normalized.
Celebrating market cap milestones is like celebrating your neighbour’s house price going up. Nice, but tells you nothing about whether the house is actually well-built.
The Three Numbers That Actually Matter
Most investors never check these. They’re not published on the first page. They require reading quarterly results or annual reports. They demand a small amount of thinking. But they predict returns far better than FII flows ever will.
Number 1: EPS Growth vs Stock Price
Most investors know the P/E ratio — price divided by earnings. When someone says, “This stock has a P/E of 25,” they mean investors pay ₹25 for every rupee the company earns.
But here’s the problem: A P/E of 25 is expensive for a company growing earnings at 5%. The same P/E of 25 is cheap for a company growing earnings at 30%.
P/E alone cannot tell you whether you’re paying a fair price. This is where PEG comes in, the Price/Earnings-to-Growth ratio.
PEG = P/E ÷ EPS Growth Rate
- PEG below 1.0 → growth is high relative to price → undervalued
- PEG above 1.5 → price is high relative to growth → overvalued
- PEG around 1.0 → roughly fairly priced
Let’s apply this to two well-known banks.
HDFC Bank (Example): P/E: 17.29, EPS Growth: 17.97%, PEG: 17.29 ÷ 17.97 = 0.96. This signals undervaluation relative to its growth.
Kotak Mahindra Bank (Example): P/E: 28.51, EPS Growth: 10.45%, PEG: 28.51 ÷ 10.45 = 2.7. This signals overvaluation price far exceeds earnings momentum.
Even though both operate in the same banking sector, the difference in PEG is massive.
And it immediately shows which bank offers better value for long-term investors.
Why Does PEG Work?
1. HDFC Bank: Moderate P/E + strong earnings growth → PEG becomes low.
This tells you the stock’s price is not fully reflecting its growth momentum. The business is compounding earnings at a healthy rate, yet the market is pricing it like an average performer. A low PEG highlights this mismatch and signals potential undervaluation.
2. Kotak Bank: Very high P/E + slow earnings growth → PEG becomes extremely high.
Kotak carries a premium valuation, but its earnings are growing much slower. A high PEG shows that investors are paying a steep price for very modest growth, which increases the risk of future underperformance if the bank doesn’t accelerate earnings.
3. This is the clarity PEG gives you:
- P/E only answers one question: What price is the market paying today?
- PEG answers the more important question: Is that price reasonable when you factor in how fast the company is actually growing?
PEG essentially converts valuation into a “price per unit of growth,” making it far more intuitive than looking at the P/E ratio alone.
Number 2: Promoter Pledging
This number is almost never discussed by retail investors. Yet it’s one of the most important. When a promoter pledges their shares, they’re using them as collateral for a loan. This is legal and common. But it creates a hidden risk.
If the company faces trouble, the stock price falls. The bank holding pledged shares as collateral gets nervous. They ask the promoter to add more collateral or face forced selling. The promoter, already stressed, cannot add more. So the bank sells the pledged shares in the open market to recover its loan.
These forced sales don’t care about valuations. They don’t care about earnings. They just need to recover money. Which means rapid selling, which means stock crash. This happened to Satyam in 2008. Promoters had pledged virtually all their shares. When the fraud was revealed, lenders invoked the pledges. Shares crashed 89% in a single day.
SEBI now mandates disclosure within 2 working days of pledging. As of 2023, 239 listed companies had reported pledges.
The red flag: Promoter pledging more than 50% of their total shareholding. Or pledging more than 20% of the company’s total share capital. When you see this, you’re seeing financial stress. The promoter needs cash. They’re using their share capital as collateral. If business gets worse, forced selling will add to the crash. You can find this in quarterly shareholding patterns on NSE website. Most investors never look.
Number 3: Operating Cash Flow
Most investors stop at earnings. Profit number. They see ₹100 crore profit and think the company is strong. But earnings are accounting numbers. Cash flow is reality.
A company can report ₹100 crore profit while generating only ₹20 crore in actual cash from operations. How? Through depreciation adjustments, working capital changes, revenue recognition timing. It’s all legal. But the cash is missing.
Another company reports ₹80 crore profit but generates ₹90 crore in cash. They’re the stronger business. Operating cash flow is in the cash flow statement, which most retail investors never read. It’s calculated as: Cash generated from operations minus Capital expenditure.
Positive and growing operating cash flow signals a business that:
- Can pay dividends without borrowing
- Can fund expansion from its own cash
- Can survive downturns without distress
- Can repay debt consistently
The most consistent profit makers in India—HDFC Bank, Asian Paints, Nestlé India—all maintained rising operating cash flow for 7-10 years straight. Not because they’re lucky. Because the underlying business is sound.
How To Use This: The Practical Framework
Before you invest, check these three numbers. Not FII flows. Not OI data.
For EPS growth: Check the latest quarterly results for EPS. Compare to the same quarter last year. Calculate growth rate. Then find the stock’s P/E ratio. Divide P/E by EPS growth. If result is below 1.0, investigate further.
For promoter pledging: Go to NSE → Company → Shareholding Pattern → Quarterly filings. Look for pledging row. Calculate percentage of total promoter holding. If above 50%, ask why. If increasing quarter-on-quarter, be cautious.
For cash flow: Download annual report. Go to Cash Flow Statement. Find “Operating Cash Flow.” Subtract Capital Expenditure. That’s Free Cash Flow. Compare this to earnings. If cash flow is consistently lower than earnings, be skeptical.
Final Thought: What Actually Signals Wealth Creation
Retail investors love visible signals. Daily updates. Exchange-published data. Easy interpretation. But wealth creation doesn’t work that way. It works through boring, difficult-to-access numbers. Cash flow. Earnings growth. Promoter commitment. These don’t excite. These don’t create trading opportunities. These don’t go viral on trading apps.
But they protect your capital. And they compound it over time.
The real market isn’t determined by foreign investor sentiment. It’s determined by business fundamentals. The stocks that outperform over years aren’t the ones with the highest OI. They’re the ones with the strongest cash flows and cleanest balance sheets.
Stop tracking what’s visible. Start tracking what’s real. Because visibility feels important. But reality is what actually makes you money.