
Most portfolios look different on the surface but move the same when the market turns.
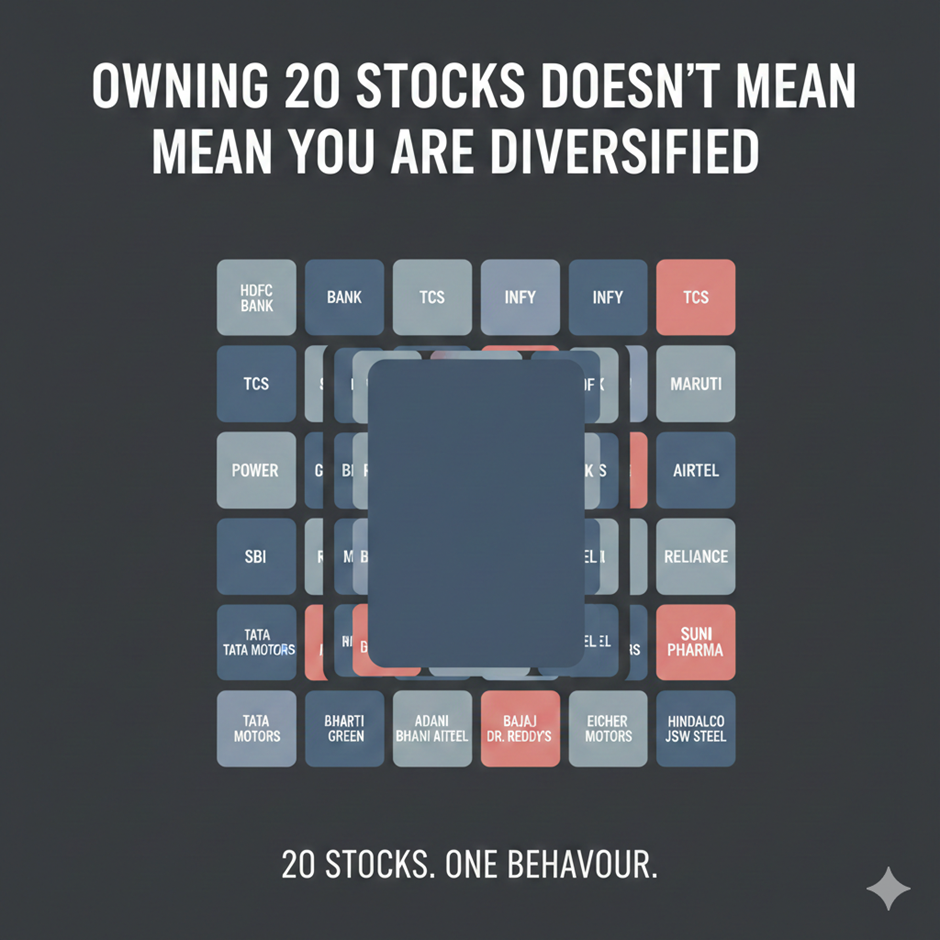
There is a sentence almost every investor uses at some point: “My portfolio is diversified. I have around 20 stocks.” And if you ask what those 20 are, the list usually follows a familiar pattern.
A couple of blue-chip names everyone trusts. Some midcaps for growth. A few small caps that did well last year. One or two PSUs someone mentioned in a group chat. SIPs running in the background because they feel responsible.
When you see all of this together, it creates a sense of comfort. It looks like different ideas. It looks spread out. It looks safe. That belief holds until the day the market turns.
The moment the screen turns red, something surprising happens. These different stocks start reacting in the same direction. Moves that were supposed to balance each other start lining up. And a portfolio that looked wide suddenly behaves very narrow.
It is confusing the first time you see it.
A private bank, a chemical company, an IT major, a PSU — how can all of them fall on the same day, at the same speed?
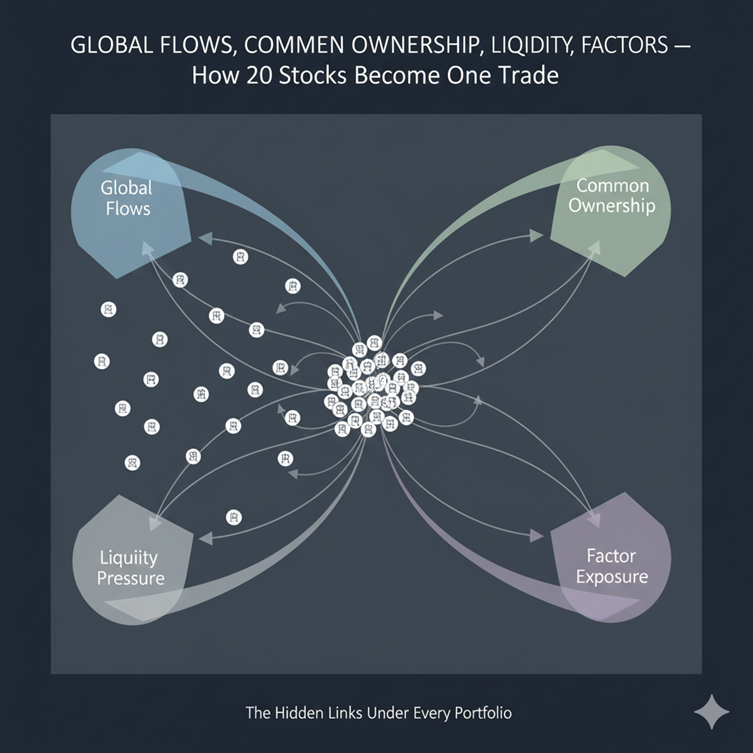
The explanation rarely sits in the sectors. It sits in the links that quietly bind these stocks together. These links stay invisible when markets are calm and show up only when the environment gets tight.
This article breaks down those links and explains why twenty names often behave like one decision when pressure builds.
1. Global flows tie your stocks together long before you realise it
Most investors judge stocks purely by the business they belong to. But a large part of the Indian market moves according to how foreign investors allocate money.
When global funds add exposure, almost everything with liquidity rises. When they pull back, almost everything falls.
To understand how strong this link is, let’s see a real example .
Between October 2024 and January 2025, FIIs sold nearly ₹3 lakh crore of Indian equities. That selling did not stay inside one sector. It hit IT, banking, autos, pharma, energy, all at the same time.
When large global funds cut exposure, they exit their entire book. Infosys, Asian Paints, ICICI Bank, Maruti — none of these businesses are related. But they fall together because the same group of investors owns all of them.
Not because something happened to each business. But because foreign flows turned in one direction. You might think you hold different sectors. But if they sit in the same global bucket, they move as one when global allocations change.
This is the first hidden link
2. Common ownership creates similar reactions in unrelated stocks
Most investors never check who owns the companies they hold. But ownership patterns quietly decide how stocks behave when the market becomes nervous.
Take this example.
Investors often combine multiple mutual funds thinking they are diversifying.
But here’s the catch. Three of India’s biggest large-cap funds share 30 to 47 percent of their holdings.
HDFC Bank, ICICI Bank, Reliance, Infosys, TCS — they appear across all of them. You believe you own 90 stocks. In reality, you mostly own the same 15, just repeated through different wrappers.
During the February 2025 correction, these three funds fell almost identically (between 8.2 percent and 8.7 percent). Different product names. Same behaviour. Because the ownership underneath was the same.
To the investor, they are five different businesses. To the market, they belong to the same group because the same hands are holding them.
This is the second link. It stays invisible until the owners start adjusting positions.
3. Liquidity connects stocks more than business cycles do
During selloffs, investors do not sell what they prefer to sell. They sell what they can sell without too much price damage.
This is why liquidity plays such a large role in uniting unrelated stocks.
Look this : March 2020 showed this clearly. The Sensex fell 38 percent in three weeks. But the sequence mattered more than the fall.
Day 1 to 3: Large caps fell first, not because they were weak, but because they had liquidity. HDFC Bank dropped more than 30 percent even though nothing changed in its business.
Day 4 to 7: Midcaps crashed harder as liquidity thinned.
Day 8 to 15: Small caps stopped finding buyers completely.
Liquidity creates a chain reaction. Investors don’t sell what they want to sell. They sell what the market allows them to sell. This chain has nothing to do with fundamentals. It is a liquidity chain.
This is the third link. It is one of the strongest.
4. Factor exposure shapes your portfolio far more than sector diversification
Most investors do not think in terms of factors. But the market does.
Momentum, Growth, Value, High-beta, Quality
These invisible buckets decide how stocks behave under stress.
Let’s say ten of your stocks have gone up because the market rewarded momentum. They may come from different industries, but they share the same underlying factor.
When momentum cools, all ten start correcting together. An investor watching their screen thinks five sectors are falling. In reality, one factor is unwinding.
Here is another example.
If most of your holdings are high-beta names because they looked attractive during a rally, they will all react sharply during any correction, regardless of their industry.
Factors silently stitch stocks into groups, and those groups react together.
This is the fourth link.
5. Correlations rise during stress, even if they stay hidden during good times
When markets are calm, correlations stay low. Stocks move independently. Charts look balanced. Everything seems diversified.
But the moment volatility rises, correlations jump. This is why in a 3-day fall, you often see fifteen out of twenty stocks dropping at the same time.
Consider this simple picture. On a normal day:
HDFC Bank moves 1 percent
Infosys moves 0.3 percent
Titan moves 0.5 percent
L&T moves 0.8 percent
Asian Paints moves flat
Everything looks independent.
On a stress day: All five suddenly fall between 2 and 4 percent.
Different businesses. Same reaction window. Because during stress, investors act in clusters, not individually.
This is the fifth link. Nothing shows it until pressure rises.
What Real Diversification Looks like:
During calm years, adding more stocks creates an illusion of safety. But real diversification is not about adding more ingredients to the same meal. It comes from assets that behave differently.
In March 2020:
- Government bonds gained 8 percent
- Physical gold gained 12 percent
- FDs stayed stable
- Stocks across all caps fell 30–50 percent
Fifty stocks or five did not change the outcome. The portfolios that survived were not the ones with more names. They were the ones that owned assets that actually moved differently.
True diversification is not having many names. It is having names that react differently to the same event. If the same news makes everything fall together, then the portfolio is not diversified even if it has twenty companies.
To understand whether you truly diversified, ask simple questions.
Do these stocks depend on the same global flows?
Do they share the same owners?
Do they get sold together when foreign investors pull out?
Do they all depend on the same factor?
Do they fall at the same time during stress?
Do they rise and fall with the same sentiment?
A practical way to test whether your portfolio is secretly one trade
You do not need a finance degree for this. You need one spreadsheet and daily price data.
Step 1: Pull daily prices for your holdings
Pick a recent window that includes both calm and stress. A simple default: the last 1 year of daily closes.
- If Google Finance works for your tickers, use it.
- If it does not, export prices from your broker, TradingView, NSE/BSE, or any data site and paste them into the sheet.
Step 2: Convert prices into daily returns
Correlation should be calculated on returns, not prices. In Google Sheets / Excel, daily return is:
- Simple return: (Today / Yesterday) – 1
- Or log return: LN(Today / Yesterday) (cleaner for comparisons)
Step 3: Create a correlation matrix
Now you want to see how similarly your holdings move. In Sheets/Excel, use:
=CORREL(Returns_Stock_A_Range, Returns_Stock_B_Range)
Do this across pairs, or build a full matrix.
Step 4: Reduce it to one “portfolio correlation” number
A simple, readable approach is Average Pairwise Correlation:
- Compute correlations for all stock pairs (A–B, A–C, B–C, etc.)
- Ignore the diagonal (1.00)
- Take the average of the remaining values
That average tells you the uncomfortable truth:
- 0.80 to 0.95 means your stocks behave like a single risk bucket during stress
- 0.30 to 0.55 means you have some genuine spreading of behaviour
- Below 0.20 is rare inside equities, and usually needs different asset classes
You only need Google Sheets or Excel.
The Bottom Line: Stop Collecting Stocks. Start Building Behaviour.
Indian investors have mistaken quantity for diversification. They have mistaken more names for more protection.
But markets do not reward quantity. They reward behaviour that stands apart during stress.
A portfolio of 20 names with 0.90 correlation is far riskier than a portfolio of five names with 0.40 correlation.
The biggest shock for most investors is not volatility.
It is the moment they realise all their “different” stocks move in the same direction when it matters most.
Because in markets, owning 20 versions of the same thing is not diversification.
It is concentration wearing disguise.
And that disguise only falls away when the market forces you to see what was always underneath.