
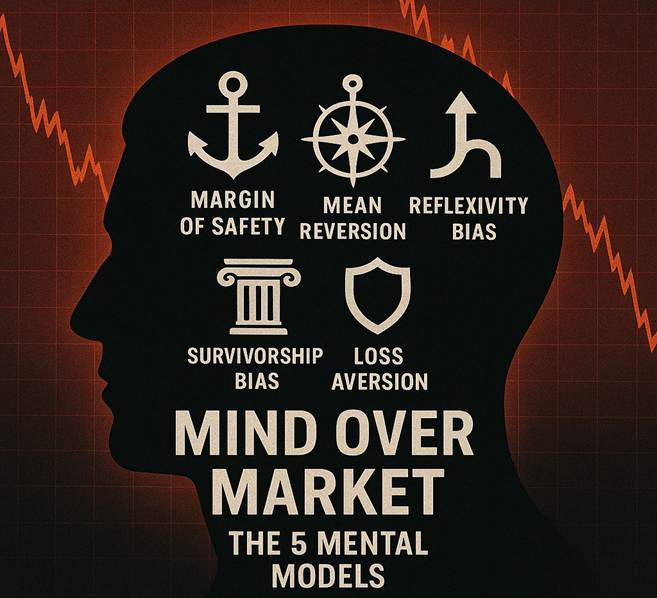
The 5 Mental Models That Saved Investors Across 5 Very Different Crashes
People often talk about the stock market as if it is a spreadsheet. They track valuations, results, sector trends, and every possible ratio. All of those matter, but they never decide who survives a crash. The difference between the investor who holds through a crisis and the investor who exits in panic rarely comes from financial analysis. It usually comes from how they think when uncertainty accelerates faster than their ability to process it.
March 2020 demonstrated this with absolute clarity.
The Infosys Case: March 23, 2020
On March 23, Nifty touched 7,610 after a 37 percent decline from the January peak. Infosys closed at ₹708. Anyone who entered the stock in January at ₹1,200 was looking at a 41 percent fall in less than two months. Interestingly, the business itself gave no signal of structural deterioration. Q3 FY20 results showed a 9.3 percent year-on-year growth. The company was functioning, contracts were intact, and demand patterns had not collapsed.
Yet the price told a different story. The emotional environment around it told an even louder one.
Infosys eventually climbed to ₹2,058 by December 31, 2021.
The thesis was correct. The reaction was not. Most investors did not lose money because the business changed. They lost money because their internal frameworks collapsed when volatility increased.
The mind makes predictable errors during panic. It does so not because the investor lacks intelligence, but because the brain is wired to prioritise survival over logic. When markets crash, five psychological distortions show up together and overpower rational thinking:
- Margin of Safety Ignorance: You never calculated a worst-case scenario. When the worst case appears, you have no buffer and react emotionally.
- Mean Reversion Blindness: You see a 30 percent decline and treat it as confirmation of further decline. You ignore the statistical reality that extreme valuations often revert back to normal levels
- Reflexivity: You mistake a fear loop for fundamental deterioration. Prices fall because people sell, and people sell because prices fall. The price movement becomes the narrative.
- Survivorship Bias: You remember catastrophic years like 2008 and assume every decline will follow the same pattern. You forget that most drawdowns recover within 6 to 12 months.
- Loss Aversion: You sell the positions that have gains because the pain feels smaller, and you hold the losers because the loss feels unbearable.
Mental models do not remove volatility from the market. They remove volatility from your decision-making. They give you a structured way to respond when the environment becomes chaotic.
Below are the five that repeatedly protected investors across different eras and crises.
1. MARGIN OF SAFETY
A disciplined buffer that protects you from your own optimism
The most painful demonstration of this principle was Satyam in 2008.
In December 2008, Satyam traded at ₹780 with a market cap of ₹50,000 crore. It was India’s 4th largest IT company. The valuation looked reasonable. The growth story looked stable. Then on January 7, 2009, the founder admitted a ₹7,600 crore accounting fraud. The stock collapsed from ₹780 to ₹90 and eventually to zero.
Investors did not get time to “wait for recovery.” There was nothing left to recover.
If you had calculated a conservative intrinsic value with a 40 percent margin of safety, Satyam would never have appeared attractive at ₹780. The framework would have forced either patience or exit. In both cases, capital would have been protected.
How to apply this model:
- Estimate worst-case earnings after assuming a meaningful slowdown.
- Apply roughly three-fourths of the sector’s historical P/E to those earnings.
- Multiply to arrive at a worst-case valuation range.
- Buy only when the current price sits 30 to 40 percent below that range.
The distance between market price and worst-case value becomes your psychological armour during crashes.
2. MEAN REVERSION
Valuations eventually return to their historical range, especially during extremes
Markets rarely stay at the extremes for long. The Nifty in 2020 is the clearest example.
- March 23: P/E touched 12.1x (far below the long-term range of 18–20).
- April 15: P/E returned to 15.2x.
- July 15: P/E climbed to 24.1x, completing a full reversion.
During this same period, Nifty moved from 7,610 to almost 11,000 within four months, and then to 13,600 by December.
Investors who understood mean reversion did not respond to falling prices with fear. They responded with curiosity. They asked whether the valuation level was sustainable. When it was clearly unsustainable, patience became the correct decision.
How to apply this model:
- Track five-year average valuation metrics for your stocks.
- During distress, observe how far the current valuation has diverged from historical norms.
- A deviation of 40 percent or more has rarely held for long durations in broad indices.
- Allow the market time to correct its own excesses.
- Accumulate when the deviation is wide and fundamentals remain intact.
3. REFLEXIVITY
Perception and price feed each other in both directions
Markets do not move only on fundamentals. They move on momentum created by collective perception. This creates self-reinforcing cycles that exaggerate both optimism and fear.
The Adani Group movement in September 2024 illustrates this.
- September 20: Adani Enterprises fell 10 percent intraday.
- Over the next three days, several group stocks dropped another 10 to 15 percent.
- By October, the stocks stabilised and recovered.
Nothing meaningful changed within the companies. Debt levels remained the same. Order books were stable. Execution pipelines were not disrupted. The entire decline came from perception flowing into price, then price flowing back into perception. It was a reflexive loop, not a fundamental event.
How to apply this model:
When you see a sharp fall:
- Examine whether any structural news is present.
- Observe trading volume; panic cycles usually show three times the normal volume.
- Distinguish between momentum-driven selling and deterioration in business.
- Add gradually if the business remains stable but sentiment collapses.
Reflexivity teaches you that not all rapid declines are signals. Some are noise amplified by human behaviour.
4. SURVIVORSHIP BIAS
Indexes recover by design; individual companies recover only by merit
You often hear stories of investors who “held through every crash and came out wealthier.” These stories are usually based on broad index performance, not on individual companies. Indexes recover because they shed weak components and absorb stronger ones.
Companies cannot do that.
Examples of recovery from the 2020 crash include:
- Infosys: ₹708 to ₹2,058
- ICICI Bank: ₹700 to ₹1,200
Examples of permanent loss include:
- Satyam, which went to zero.
- Many global financial companies from 2008 that never returned to their earlier valuations.
Holding through fear works beautifully for broad markets. Holding blindly through structural problems destroys capital.
How to apply this model:
- Use index investing to navigate macroeconomic shocks.
- Review individual stocks for changes in business trajectory.
- A drop without news usually points to market conditions, not business failure.
- A drop accompanied by fraud, regulation, or structural risk requires immediate reassessment.
Survivorship bias helps you avoid assuming that all declines are recoverable.
5. Loss Aversion
You remain calm in a crisis only when you actually understand the business
The 2022 tech correction was a stress-test for this principle.
Unprofitable SaaS companies with unclear economics lost 50 to 70 percent of their value.
Profitable SaaS companies with transparent cash flows fell much less.
Investors who understood the business models knew which movements were temporary and which indicated deeper concerns. Investors who bought without clarity were left with uncertainty during the drawdown.
Before buying a stock, ask yourself:
- Can you explain the business model in two clear sentences?
- Do you understand unit economics well enough to estimate long-term sustainability?
- When revenue increases, does profit accelerate or lag?
These questions become anchors during volatility. If you cannot answer them comfortably, you will struggle to hold during a crisis.
THE CLOSING
Spreadsheets capture numbers. Markets capture behaviour.
During stable periods, the spreadsheet wins. During crashes, behaviour wins by a wide margin.
When the screen turns red, the gap between intrinsic value and emotional reaction becomes visible. Mental models occupy that gap. They give structure to situations where price movements send contradictory signals.
Investors who survive crashes do not do so because they have extraordinary courage. They survive because they have frameworks that prevent emotion from dictating action.
Every major crash reveals the same insight: you can study markets for years, yet in the decisive moments, your own mind is the final hurdle.
The next correction will come. When it does, knowledge will matter.
Your reaction will matter more.
Hashtags:
#InvestingFrameworks #MentalModels #IndianMarkets #BehavioralFinance #LongTermInvesting #InvestorMindset #MarketCrashes